

















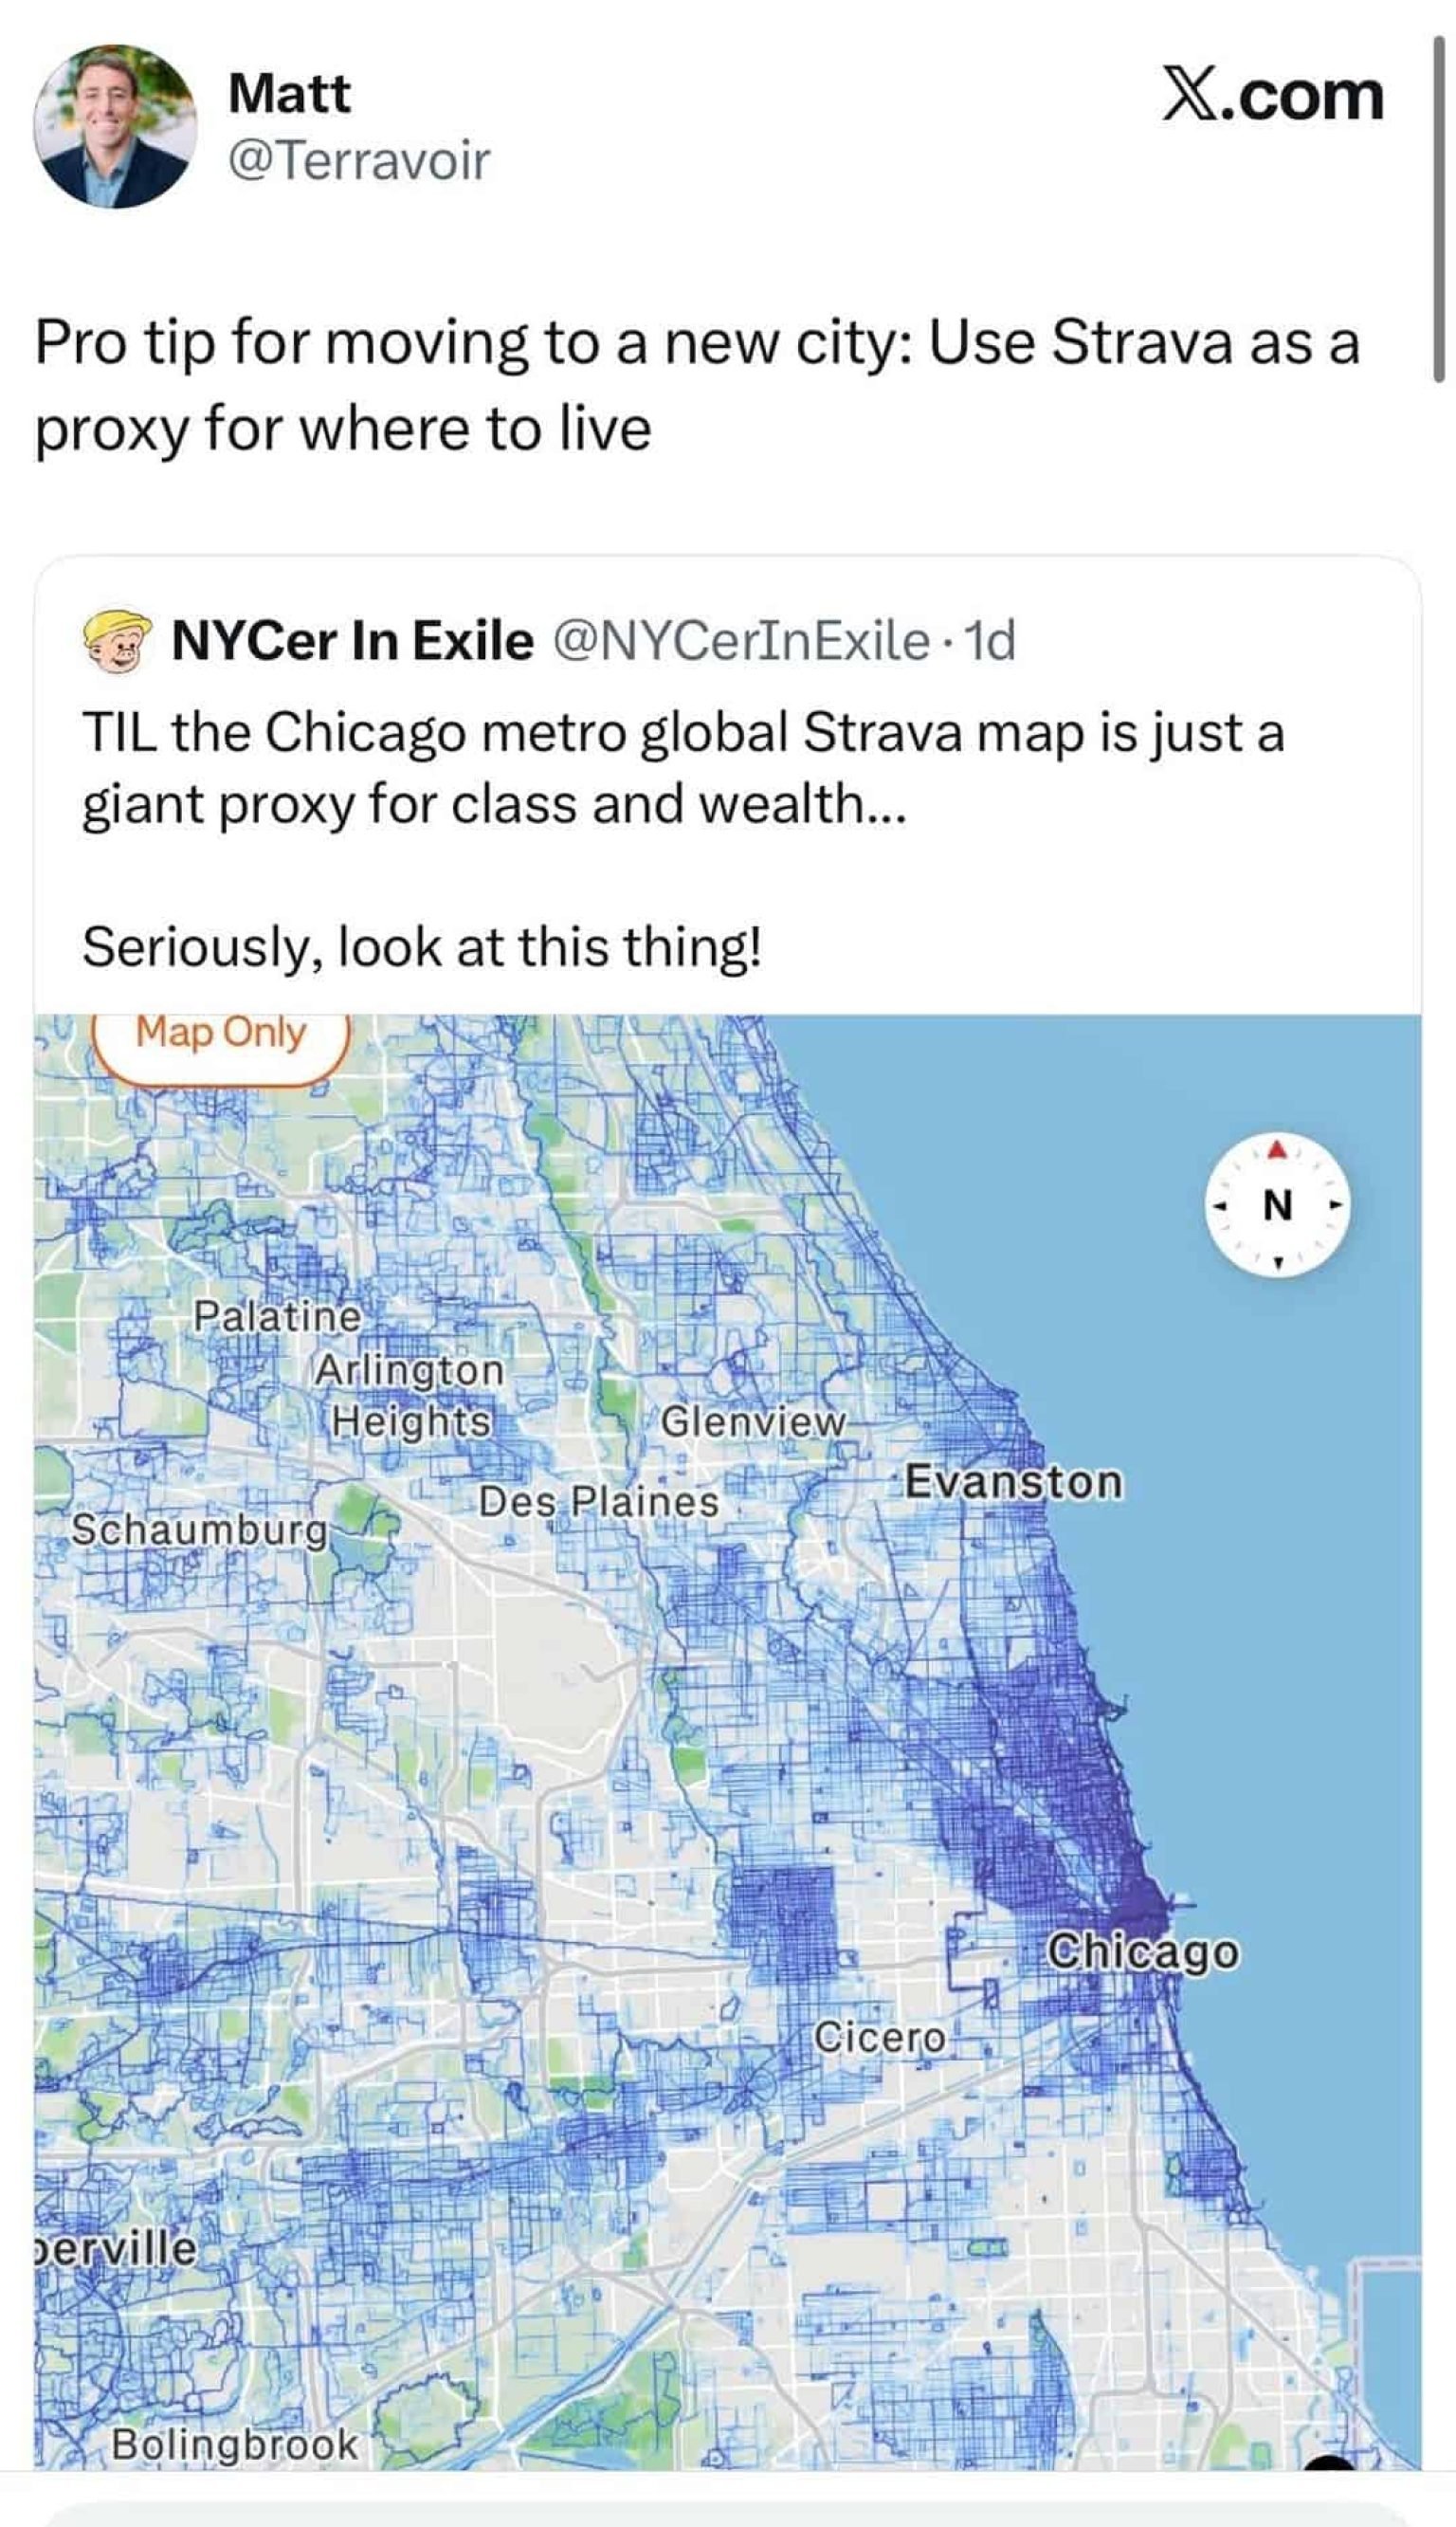
A map built to help runners find their next route is starting to become a way people decide which neighborhoods might be worth living in.
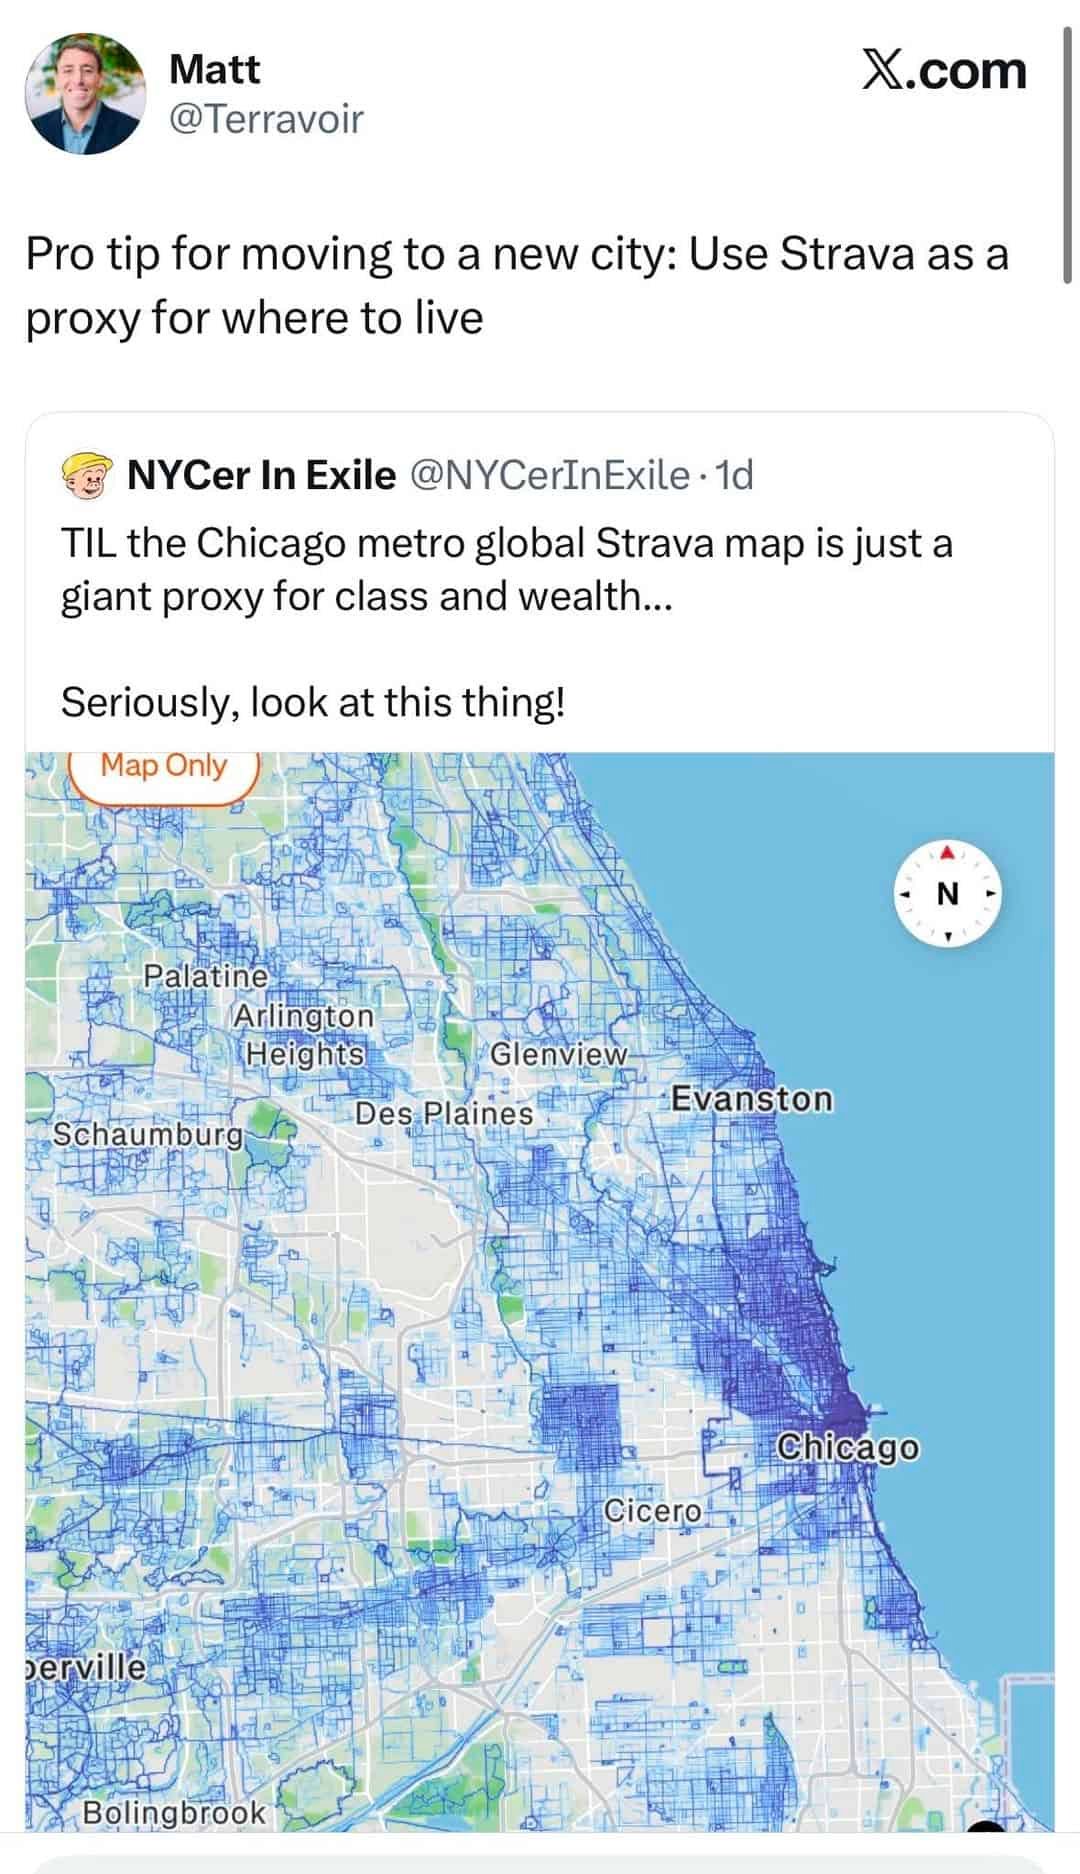
This week, a Strava heatmap of Chicago went viral after one user called it “a giant proxy for class and wealth.” Then someone spotted the obvious second use: “Pro tip for moving to a new city: Use Strava as a proxy for where to live.”
It started like a million other memes that make the rounds online before fading away. But the users actually stumbled onto something surprisingly insightful. Strava has accidentally assembled a map of where certain people feel able (and choose) to move through a city for pleasure. In practice, these heatmaps can reflect parks, good sidewalks, trails, disposable income, leisure time and perceived safety.
If it’s not on Strava, it doesn’t exist
Among runners and cyclists, there’s an old joke: if it’s not on Strava, it didn’t happen. You can run a marathon, climb a mountain or cycle 100 miles, but unless the little orange app recorded it, did anyone really see it? The line has become such a fixture of exercise culture that Strava itself now uses “STRAVA OR IT DIDN’T HAPPEN” in its advertising.

Strava is part fitness tracker, part social network. People use phones and GPS watches to record runs, rides, walks and hikes, then post those activities for friends and strangers to see. But years of use have given the app its own miniature language. A “kudos” is Strava’s version of a like. A “segment” is a particular stretch of road or trail where users compete against one another. Run or ride one faster than everybody else and you can earn a crown as the King or Queen of the Mountain; repeat the same segment more than anyone else over 90 days and you become its Local Legend. Strava has developed a culture and a vocabulary of its own.
This app (and others like it) have taken something private (going for a run) and made it measurable and social. They also made it more competitive, but that’s a different story.
Strava says it has more than 200 million users, and many of them obsessively record where they exercise. When you plot all of this, you end up with a pretty stunning map. Strava’s global heatmap turns millions upon millions of recorded activities into glowing traces across streets, trails and parks.
People are now noticing that the resulting picture can resemble other maps of a city. In some places, Strava activity appears to echo patterns visible in maps of wealth, infrastructure and segregation. It can highlight places where recreational movement is comparatively easy — although population density obviously matters too. You can also see patterns associated with walkability, as this Reddit user from Bengaluru noticed.

If the places where people run and cycle recreationally tend to have parks, calmer streets, useful paths and residents with enough leisure time to exercise, perhaps the heatmap could help a newcomer answer one of the hardest questions about an unfamiliar city: Where would I actually enjoy living?
One of the most upvoted responses was immediate: “This map actually tells you which areas in Bengaluru you should consider living in.” Another commenter thanked the poster because the map could help them choose “better and clean areas to live in.”
“It’s basically map of rich people and tech corridors they live in,” the commenter wrote. “It is just that people who own smartwatches lives there.”
The thing is, both interpretations can be true.
Workouts and real estate
Strava heatmaps record movement. But in most parts of the world, for a residential street to light up with recreational running or cycling, a remarkable number of conditions may have aligned.
Someone has to live nearby or choose to travel there. They need the time and inclination to exercise. The route needs to connect to somewhere useful or enjoyable. There may be sidewalks, trees, bike lanes, a waterfront or a park. Crossing the street cannot be unbearable every 200 yards. The person has to feel comfortable enough to spend time there outside.
And, crucially, they have to be the kind of person who records that movement on Strava.
So, it’s not exactly a census map. It’s something closer to a map of observed preference among a very particular, self-selected group: places where Strava users repeatedly choose to spend their recreational time. Some people see that as a mark of a desirable place, and there is some actual science supporting parts of this idea.
A 2023 study of running activity in Boston used Strava heatmap data alongside information about the street environment. The researchers found that runners tended to favor streets perceived as accessible, open, clean and safe, particularly those with natural features. Streets filled with interruptions and distractions attracted less running.
In Baltimore, the pattern is even more striking.
Baltimore planners and researchers have long described the city’s geography using two striking shapes. The affluent, disproportionately white central corridor running north from downtown is known as the White L. Meanwhile, predominantly Black neighborhoods stretching east and west form what has become known as the Black Butterfly.
In 2019, Runner’s World reported that Baltimore’s Strava heatmap seemed to reproduce that divide. Running activity glowed heavily through the White L while broad areas of the Black Butterfly remained much darker. The image resurfaced this April when a Baltimore Reddit user placed a recent Strava heatmap beside a demographic map.
But it gets even more interesting.

The useful bias
A peer-reviewed study published online in 2025 and in Mobilities in 2026 interviewed transportation professionals in the United States and Britain. The experts regarded Strava data as useful and often statistically correlated with observed cycling, while simultaneously viewing it as demographically biased toward younger male cyclists.
That study also cautioned that planning around the people most visible in digital data can reinforce existing inequalities in whose movement gets noticed.
A separate 2026 study offers a vivid example.
Researchers comparing Strava Metro activity with survey data from recreation areas found that 93.5% of the Strava sample was male and 93.6% was cyclists. People aged 35 to 54 accounted for 62.9% of the Strava sample, compared with 43.9% of the survey sample. The researchers still found Strava useful for estimating trail use. It simply did not represent everyone using those places equally.
This is the central paradox of the heatmap.
The data can still be useful despite its bias. But it becomes dangerous when we forget that the bias is there.
That is also what makes the heatmap such a seductive guide to a city. You can already look up income, parks, transit, crime statistics or walkability. Strava adds something different: a record of where a particular subset of people repeatedly chooses to run, walk or cycle. That can reflect comfort, infrastructure and access, but it cannot tell you by itself whether a neighborhood is safe, wealthy or desirable.
The old joke says that if it’s not on Strava, it didn’t happen. Applied to cities, that joke becomes a little more uncomfortable.
If a neighborhood doesn’t glow on the map, it doesn’t mean nobody walks there, runs there or enjoys living there. It may only mean that fewer of those lives are being recorded. But it’s less clear.
For city planners (and people trying to understand an unfamiliar city) Strava maps may contain useful clues. But perhaps the most revealing question isn’t simply where the map glows. It’s why some places barely appear on it at all.